Running Simulations & Viewing Results
These guides provide a handy reference to the features of the applications that are installed with the OpenStudio Application.
Weather File and Design Days
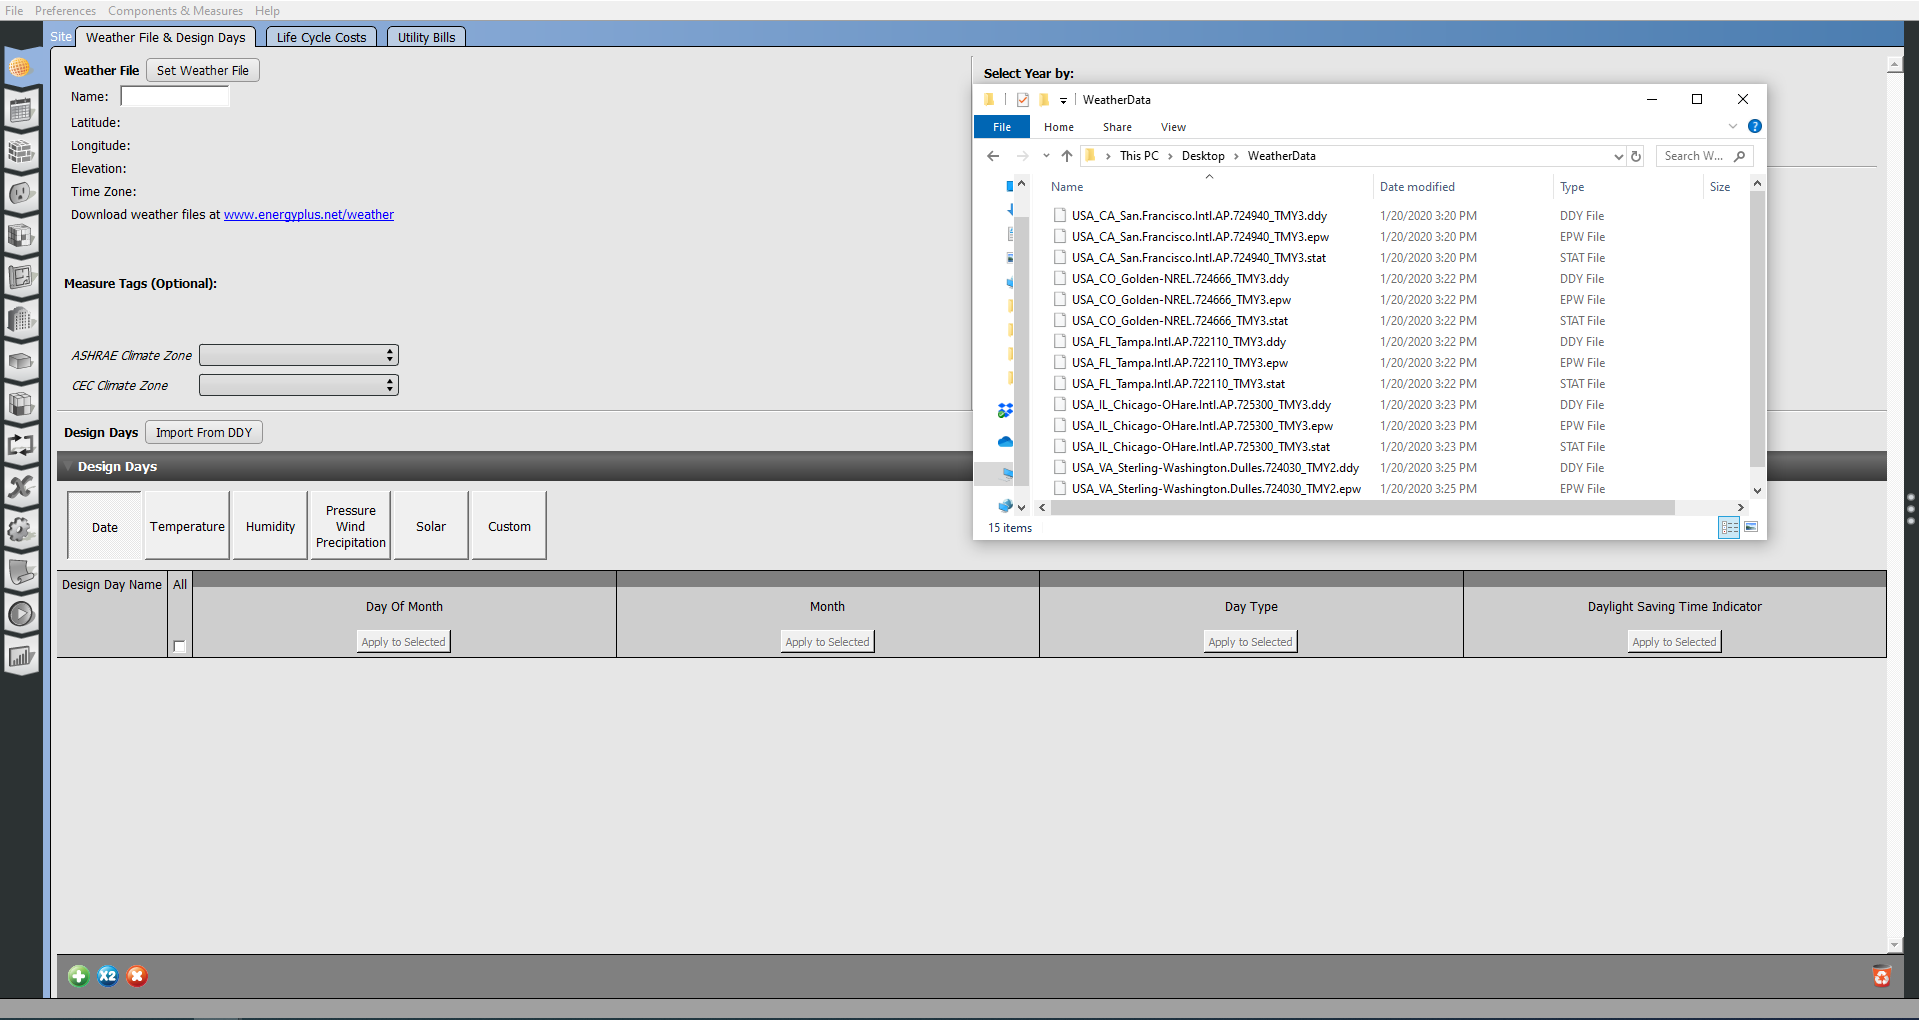
Add weather files in the OpenStudio application under the Site tab (first vertical tab) on the left and the Weather File & Design Days sub-tab across the top. You can download weather files on the EnergyPlus site.
Above: Screenshot of browsing for design day file.
Requesting Output Variables
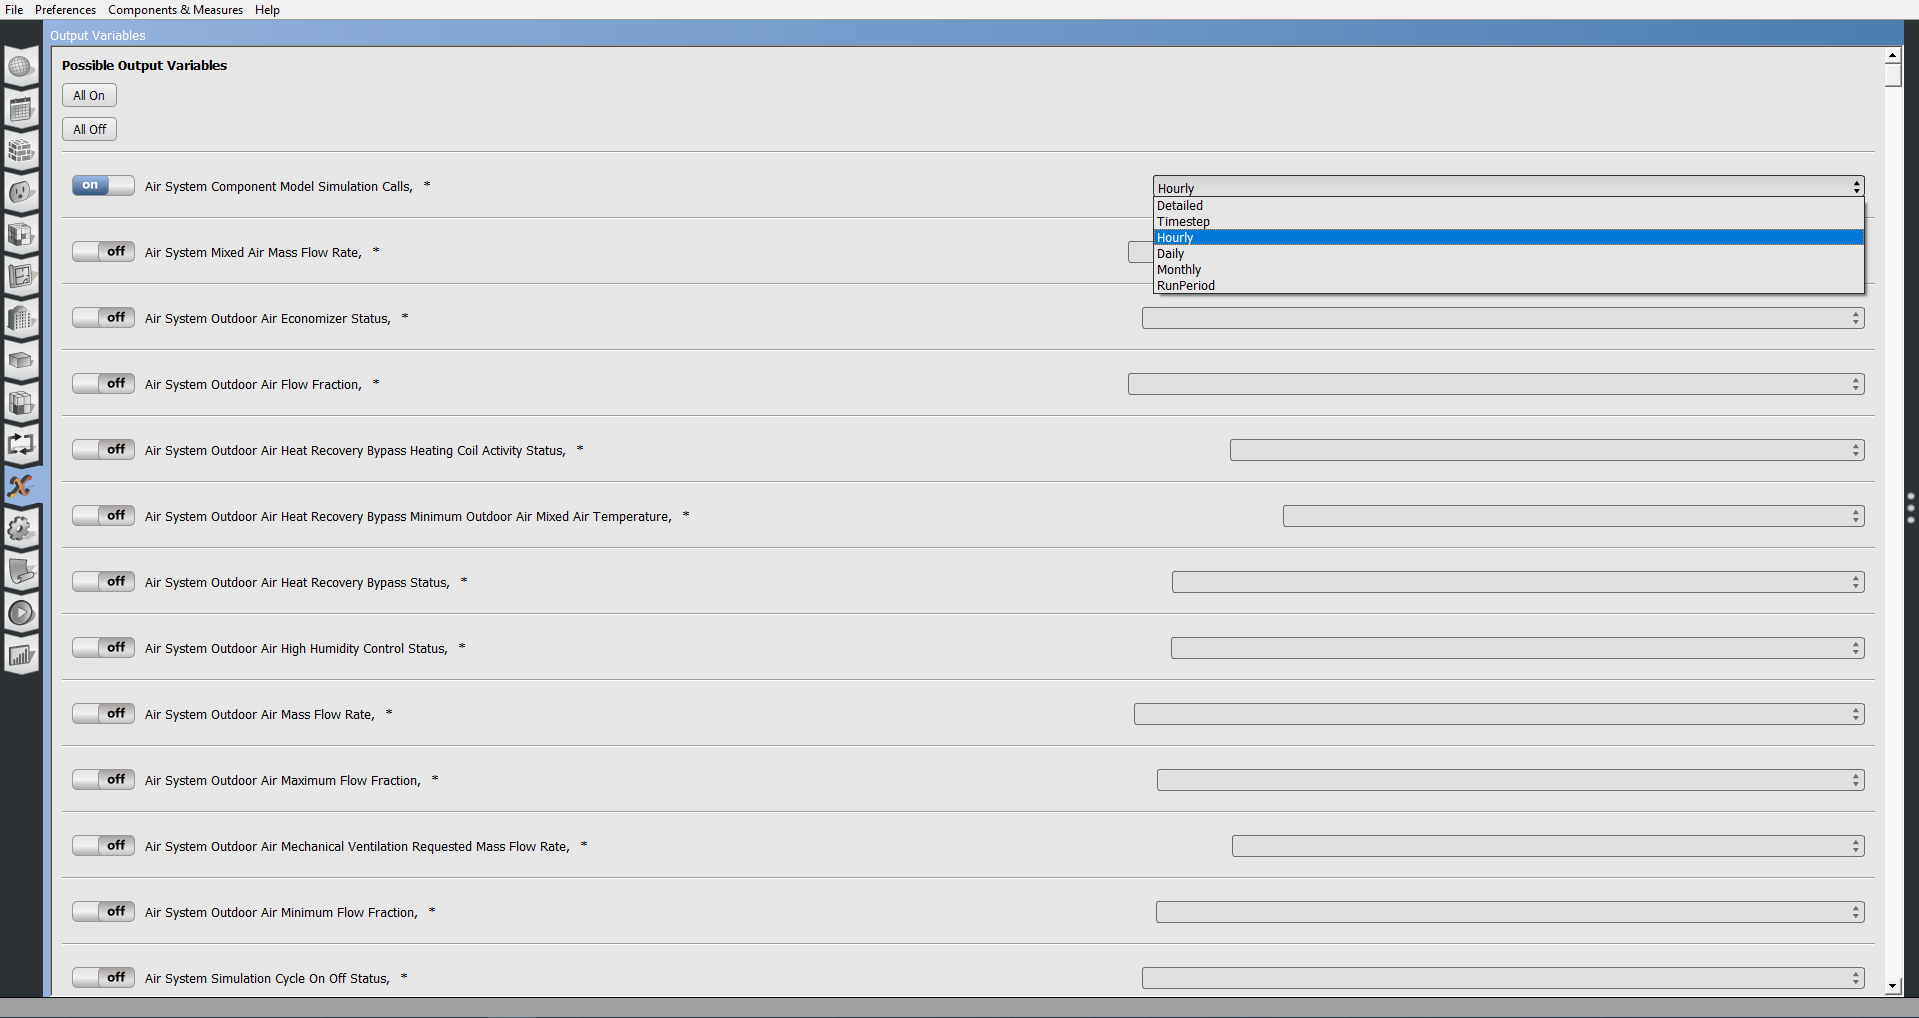
To select an output variable turn the toggle button to show a blue on. Then set the detail level you want from the drop down menu.
Above: Screenshot of selecting output variables.
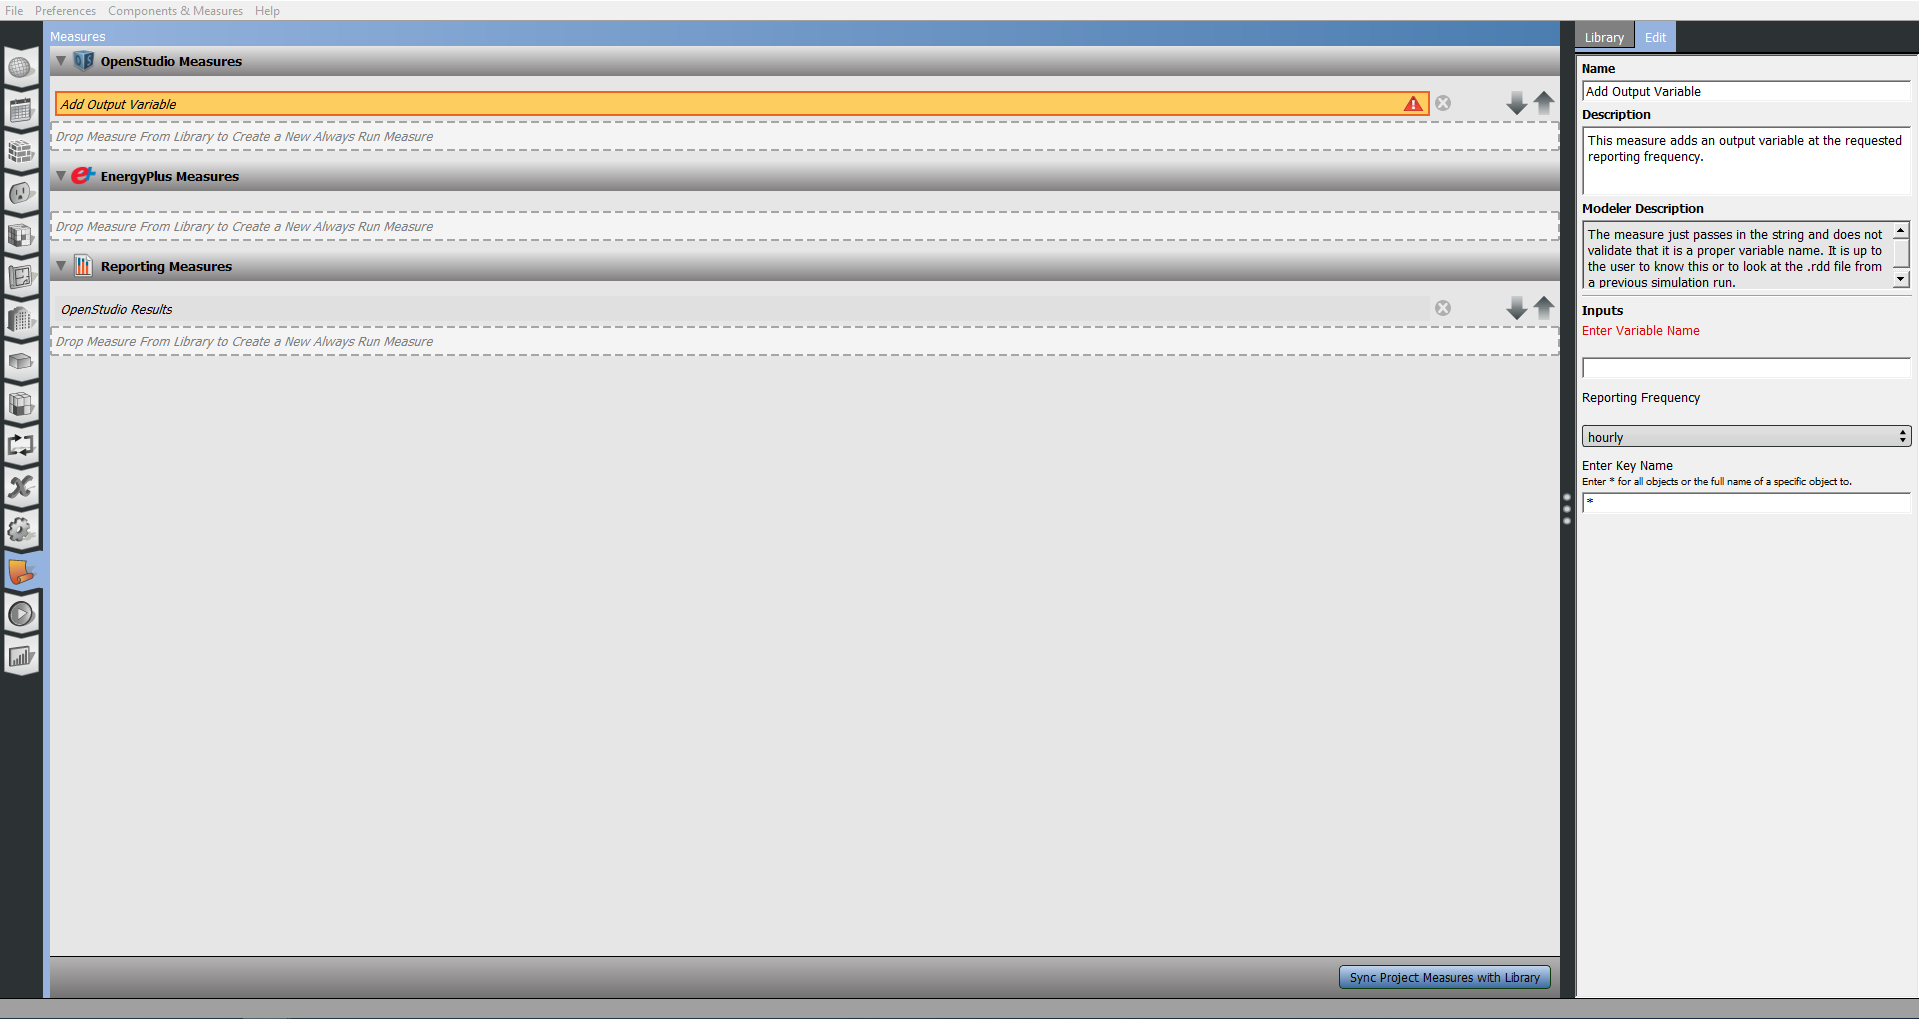
You can also choose variables to collect data on by using the Add Output Variable measure after downloading it from the BCL.
Above: Screenshot of the variable measure being added to a project. Just type in the variable you want to collect. This will return the variable's value for all associated objects within the model. To get the variable's value for a specific object, enter the full name of this object.
Running a Simulation
To run your simulation click the green Run button.
Above: The progress bar displays the status of the run.
Looking at Results
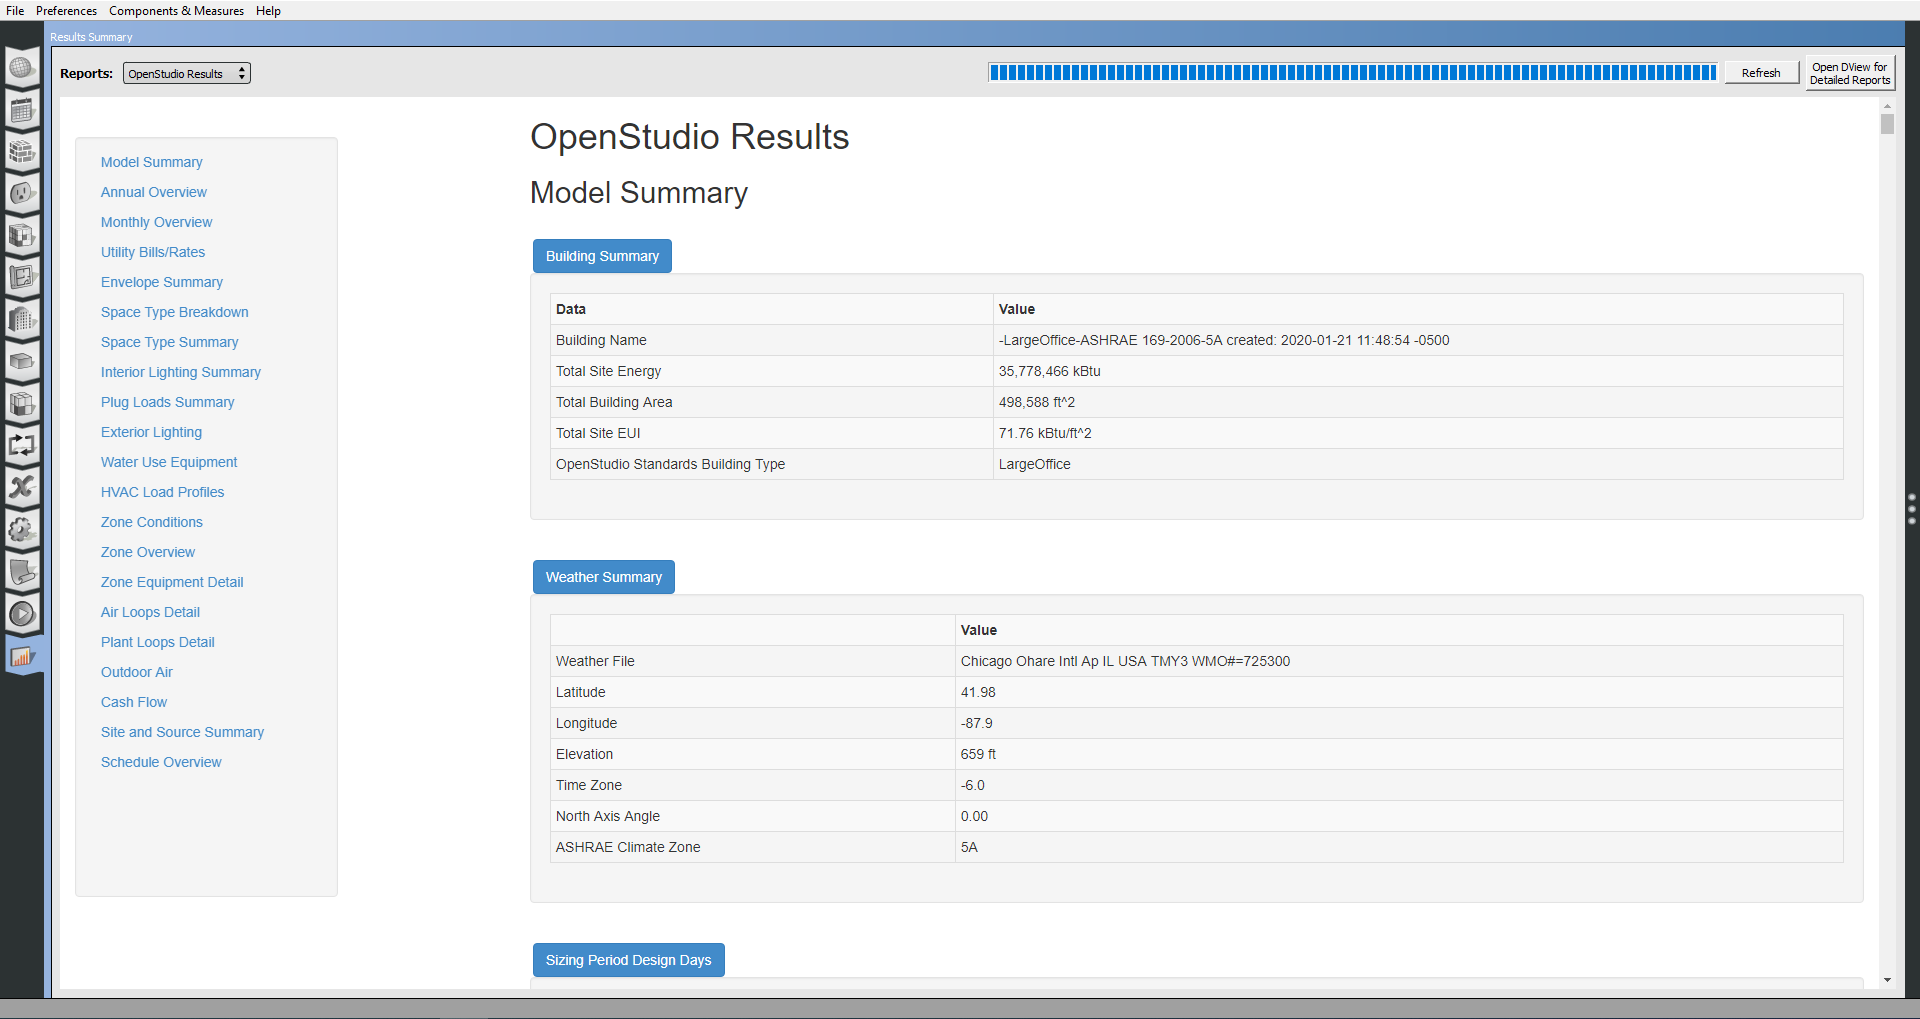
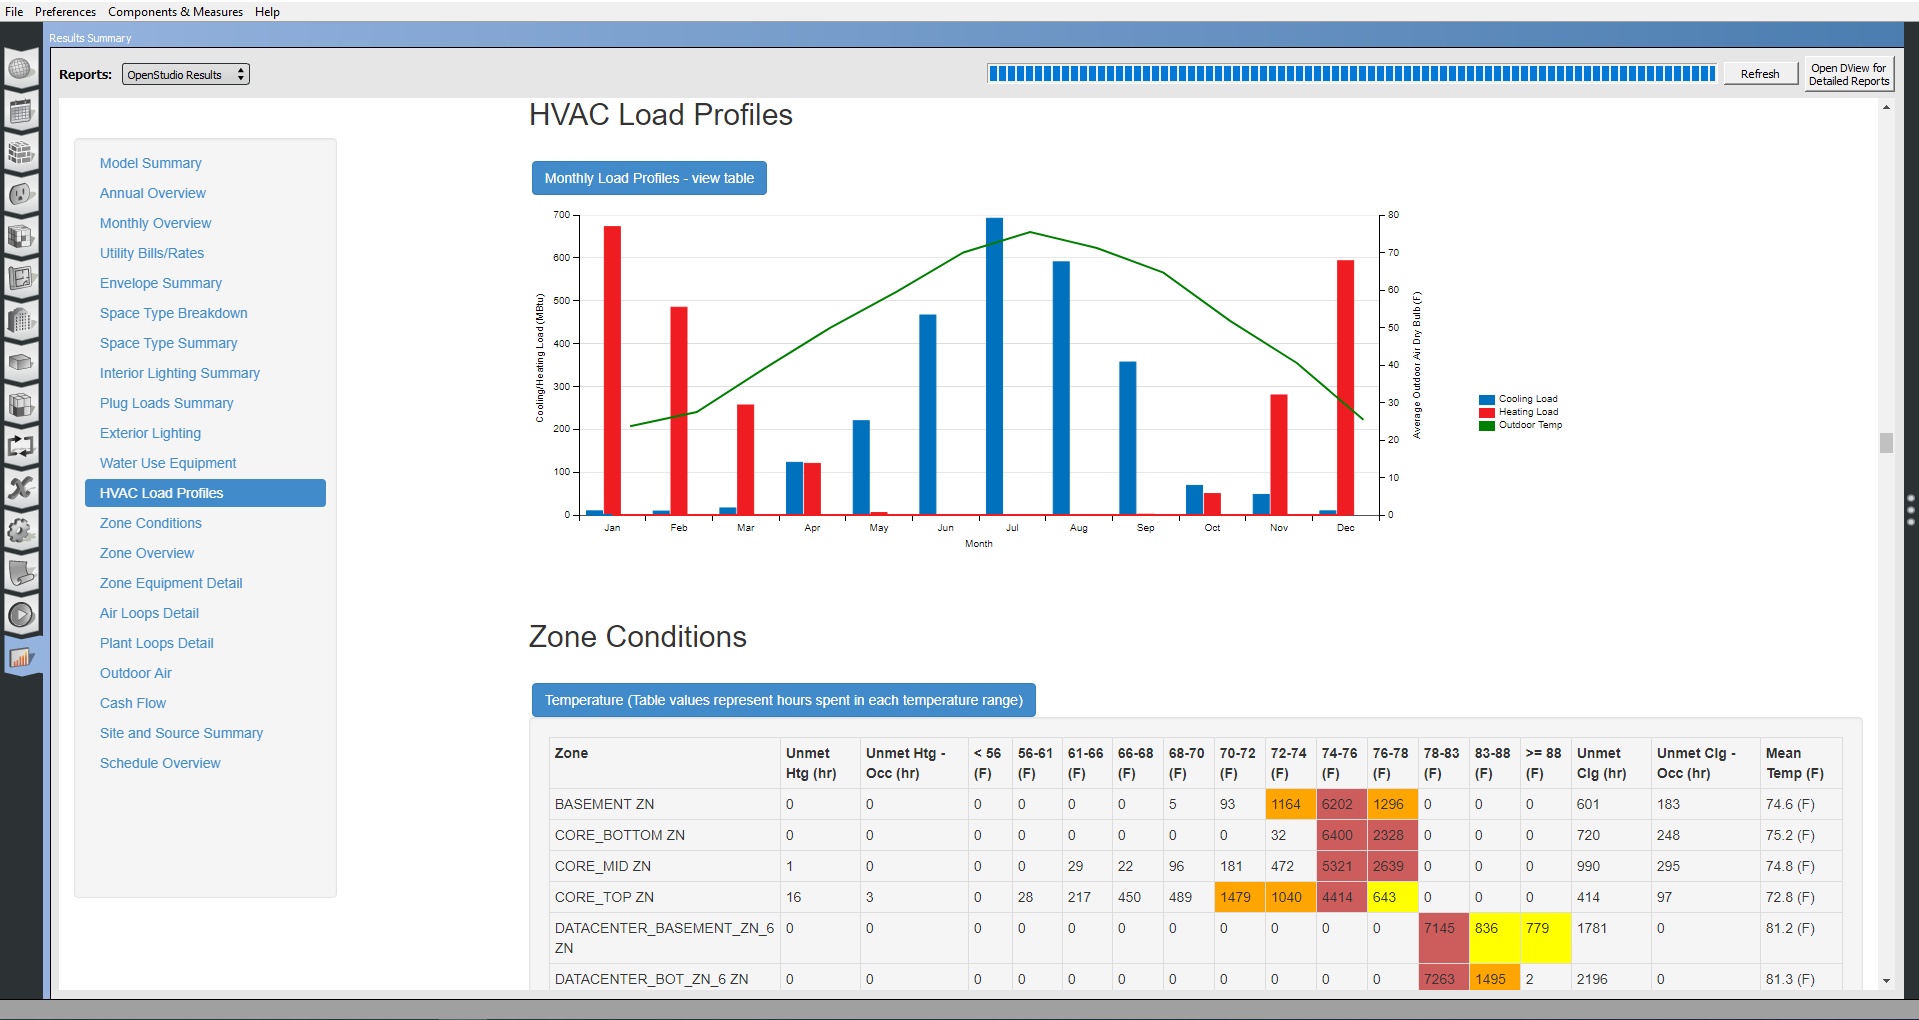
Standard OpenStudio Results are provided with your run. Learn more about the OpenStudio Standard Results measure in our References Section.
Above: This screenshot shows an example of the standard OpenStudio Results.
Above: This is another chart available in the standard OpenStudio Results.
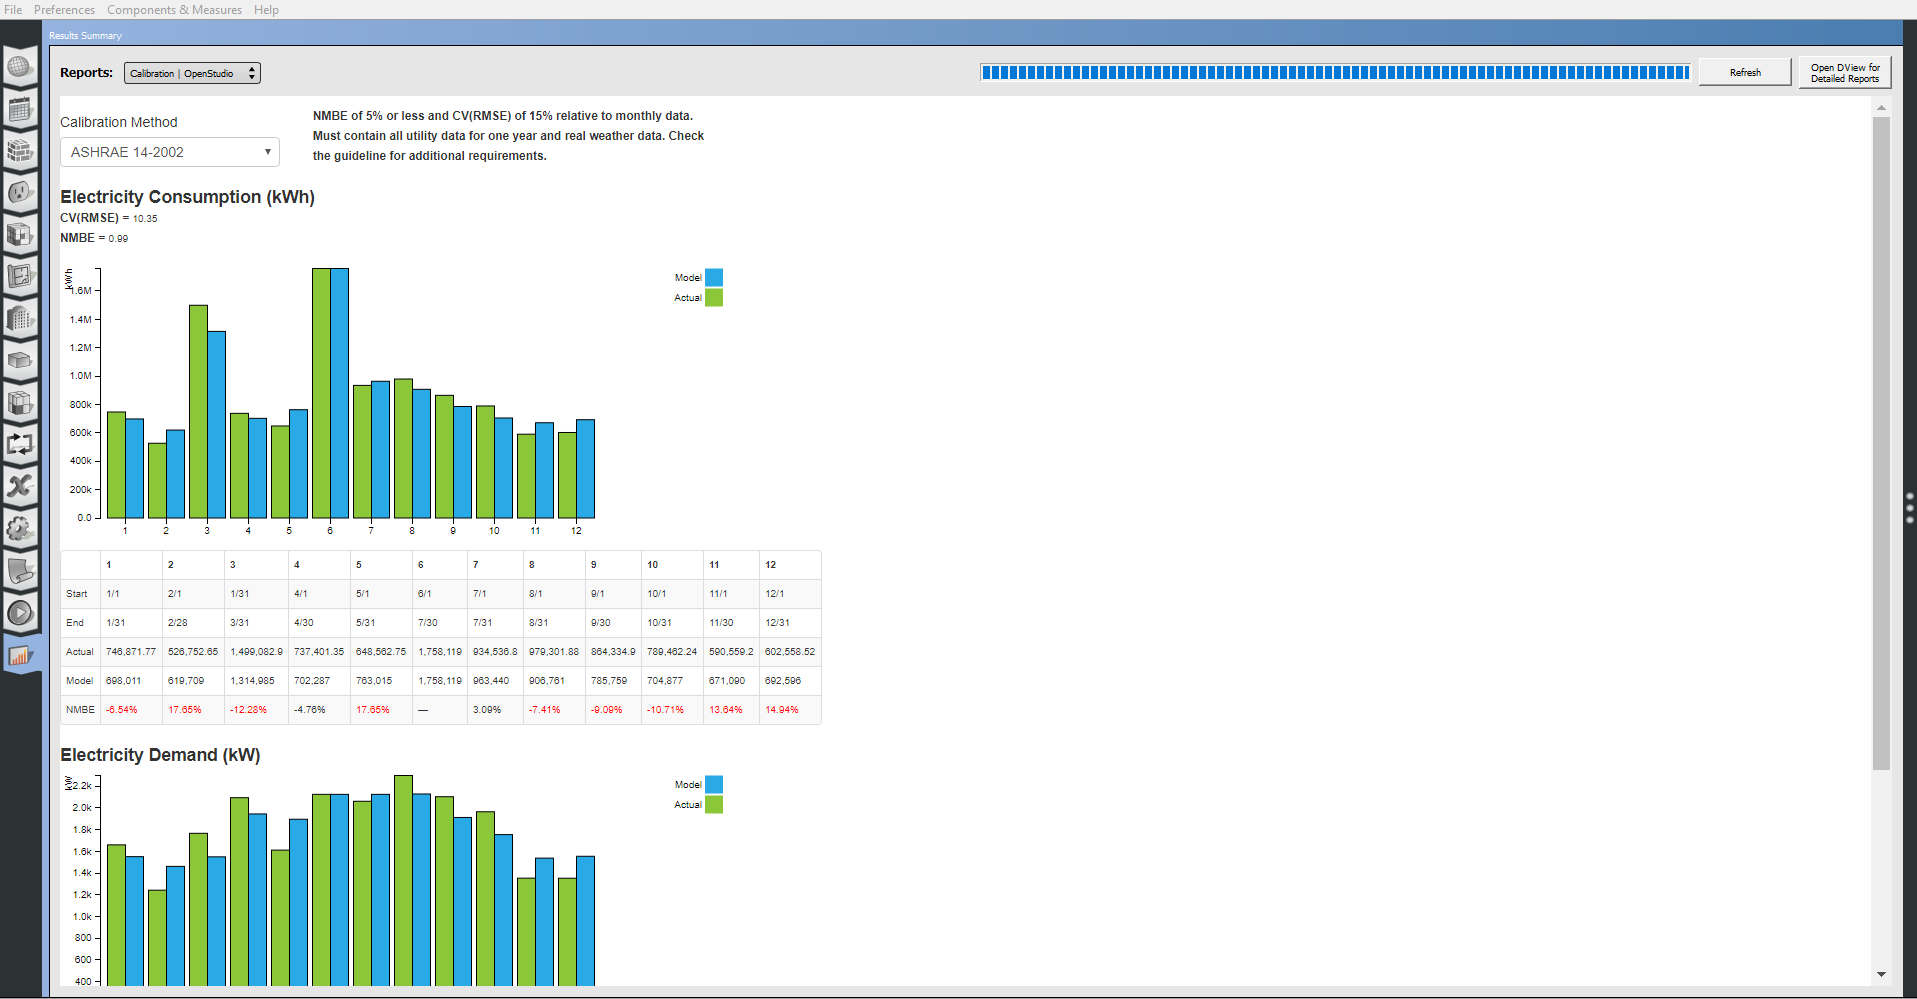
You can also use measures to add additional reports. For instance, you can download the calibration report measure from the BCL. This measure allows you to view simulation results that are associated with any added utility bills. Another option available for adding additional reports is the generation of custom reports. These are created by writing your own measures. Downloaded or created reporting measures are applied within the OpenStudio Application Measures tab.
Above: The calibration report compares utility bills with the model.
Using Data Viewer
Data Viewer (DView) displays time series results, which are produced from EnergyPlus report variable requests. It reads the SQLite database of the EnergyPlus engine and presents the time series data using line plots and heat maps. Furthermore, additional graphical/tabular formats can be harnessed to visualize simulation variables that are independent of time. Learn more about DView using guides created by researchers at the National Renewable Energy Laboratory.
